2023. 3. 19. 09:00ㆍ커피 이야기
We can take a step back to look at water activity and overall shelf life from a wider perspective.
We use a few labeling systems in our longitudinal data set.
One of those is for the round in which a coffee is cupped, and another serves to categorize the PSS water activity level.
Round is always the PSS, round 2 is the ARR, and rounds 3 and 4 are subsequent SPOT cuppings, spaced by about three months.
The three-month spacing for SPOT cuppings is on the one hand a matter of anecdotal periods of change, and on the other tends to mirror the initial shipment period.
With this system we'll see a single coffee four times in a year.
The PSS water activity categories (HML for short) are shown in the table below.

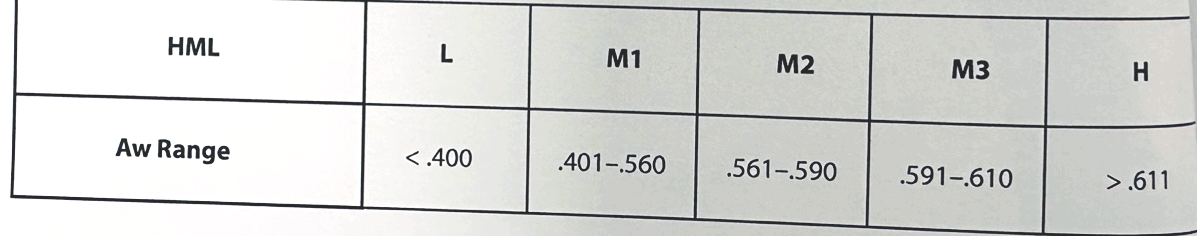
While it is difficult to see at this scale, the primary difference between the water activity groups as shown here are the minor alterations in slope from one line to the next.
Note how the spacing from L and M to M and H increases slightly with each round (M actually arrives as well as L, losing around 1.1 points, before declining more rapidly).
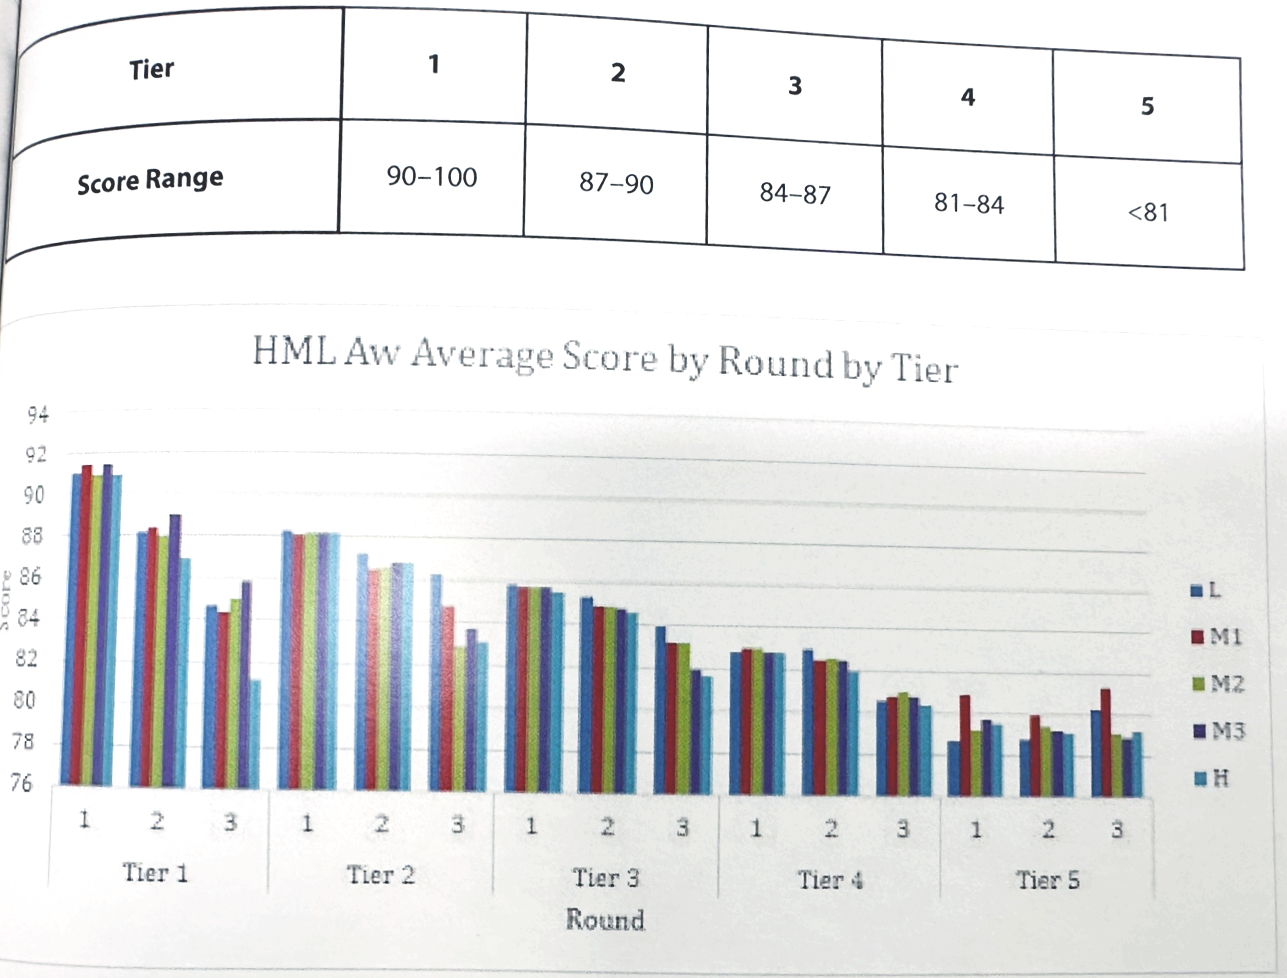
We can break the above chart into subgroups by initial score tier.
Because relatively few coffees make it all the way to Round 4 cuppings, the extra division of the data into score tiers means that we lack sufficient data to include Round 4 in the analysis below.
We again see that the lower Aw samples tend to have more shallow slopes.
출처 : CAFE IMPORTS