We set up two trials, as well as analyzed our cumulative dataset to further investigate the role of Aw in the roasting process of specialty green coffee.
In one trial we took samples of various coffees from the roaster at 2, 300 and 310 degrees Fahrenheit.
Once cooled, we measured the Aw of these samples to see if the Aw of coffees just prior to Maillard in roasting significantly rearranged relative to their original Aw.
The second trial that we conducted dealt with manipulating the water activity of multiple samples of a single coffee.
Here we were curious to see what might happen when the coffee variable was controlled and the Aw was changed.
We begin our look at water activity and browning in roasting by looking at correlation data between Agtron output and Aw input.
The density distribution of our ground Agtron scores is shown below with a normal curve overlay.
The frequency distribution is also shown. The data is near normal with a very slight positive skew.

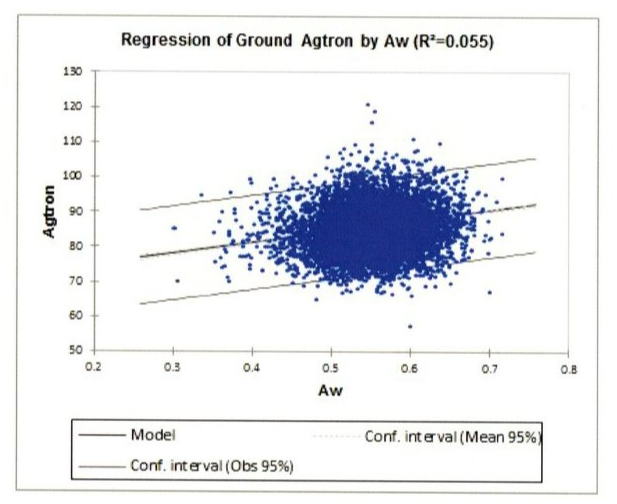
Finally, we look at the regression of Agtron by water activity.
The correlation between water activity and Agtron is 23.5 percent.
The positive correlation indicates that to a small extent as water activity increases, Agtron does too.
Generically, this means that as water activity increases roasts become lighter.
The R for the plot tells us that very little of the variability in Agtron (~ 5.5 percent) is explained by water activity.
While there is a slight positive correlation, the linear model clearly is not a good fit for the data.
Looking at individual origins we see some variability, though overall things look much the same.
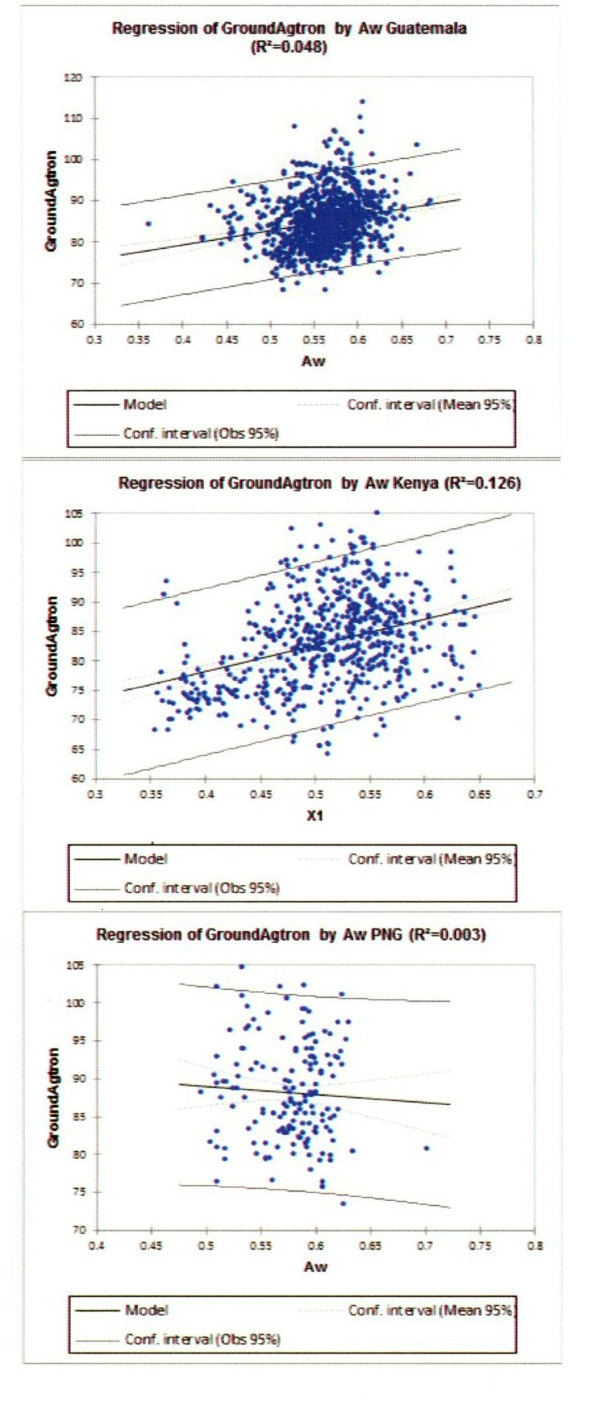
Papua New Guinea is the only origin that we observe to have a negative relationship (and a very slight one at that).
Even in the PNG plot, the dashed lines indicating the confidence interval of the mean are strongly curved.
If you look closely, all CIM lines are somewhat curved.
These give us the range for the possible best fit (model) lines through the data.
Returning to the PNG plot, we can see that even though the model line tracks slightly negative, the plot is clearly random and the strong curve of the mean confidence bands allows for both positive and negative orientations of the model.
Kenya is the only origin observed where Aw seems to explain Agtron by more than 10 percent (12. percent).
Realistically, the Kenya plot appears to be quite random, with the stronger correlation and model fit being driven by a loose cluster of low Aw-low Agtron samples.
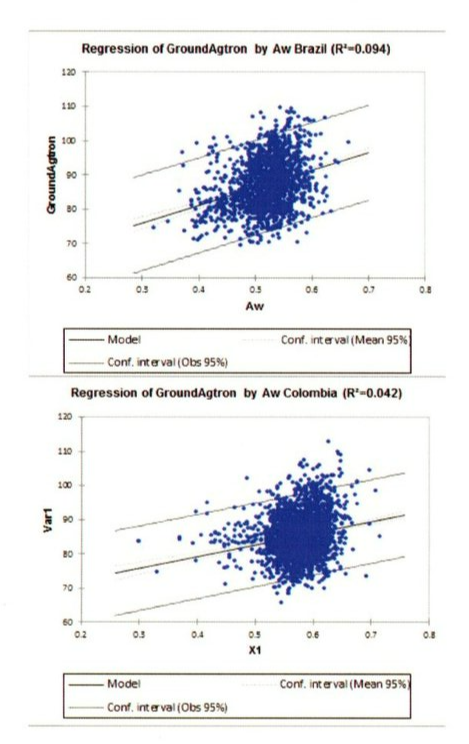
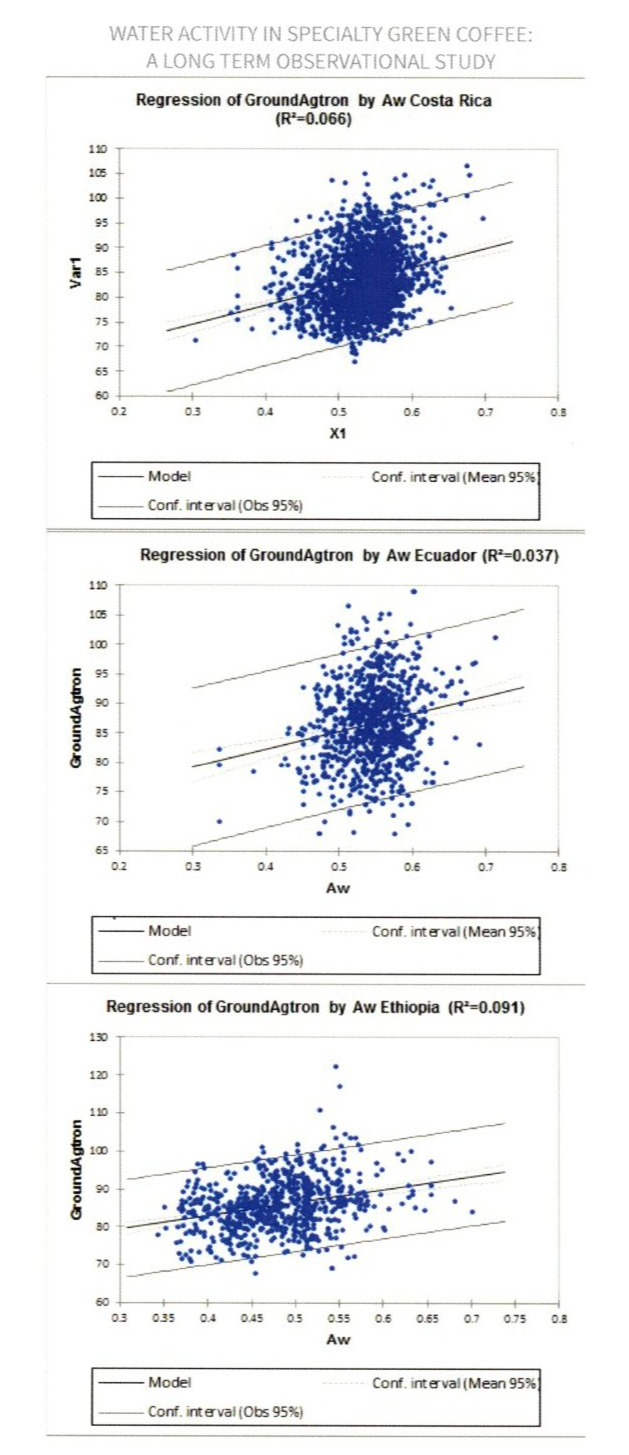
We can see in these charts that given very similar roast inputs across a wide range of coffee variables (origin, processing, variety, age),Agtron output and Aw input have very little relationship.
While the scatters for each origin can occupy relatively unique X,Y zones in the plot, each of the Origin regressions overall looks similar to the original Regression of Ground Agtron by Aw.
We should keep in mind that this data is pulled from uniform time-temperature roast profiles.
What this means is that the roasting machine's BTU application is merely sufficient to cause a given coffee to follow a predetermined temperature-at-time series.
This does not test how coffees behave given the same roast input, but how they behave when required to reach the same roast temperatures at the same roast times.
The automation and accuracy of the S means that we do not actually know how much more energy is required to keep these higher water activity coffees on the profile line.
출처 : CAFE IMPORTS


